This past week I have been fortunate enough to have the time to create something for fun.
I made this page, and the toy implemented there is the topic of this post. The code associated with this post is here.
The mouse toy element in spiral toy is 300 points, and 299 lines. I have always been impressed by the ability of javascript to do fairly complex calculations per frame and maintain a good frame rate, so I was optimistic that the calculations required for each frame would not drop the framerate much.
The x-y coordinates of the mouse are converted to polar coordinates. Instead of marking the x and y position of each point, polar coordinates label every point using circles. The radius term tells you how big the circle is, and the angle (rho) tells you what part of the circle your point is at. The function I used in the code will give an angle between pi and minus pi.
For this project, having that angle is important because it’s the exact same angle that I used to create the spiral. Polar coordinates have a special usefulness here because the angle term responds to multiplication differently than a normal coordinate would.
Basically the job of mouse toy is to take one polar coordinate, and turn it into 300 polar coordinates, then draw a line connecting them all.
The 300 points angles. This is done by multiplying taking each number 1-300 and multiplying the original input angle by that number. Because all the angles are stuck rotating around the circle, if an angle becomes larger than pi or smaller than minus pi, it will simply continue to spin around the circle instead of escaping. Many of the patterns created are related to how far the angles are able to travel around the circle when they are multiplied, and what proportion of the entire circle the original angle is.
Using the numbers 1-300 as their own r term would have been sufficient to make a spiral, but we still have the radius term from the original mouse position. If we throw that back in and multiply the radius term for our new points with that original radius, it becomes possible to scale the size of the resulting spiral by moving the mouse in closer or out further from the center of the screen.
When the angle of the original input comes close to an even fractions of pi, the resulting points that form the spiral align with each other and form geometric shapes. This is not difficult to understand in principle. If you take the 90 degree angle, pi/2, as your input, the product of that angle and any number will still be divisible by pi/2. This means no matter how many times you rotate around the circle, the last bit left over will always line up with one of the four directions that could be divided by pi/2.
You can see this in practice using the mouse toy, by placing the mouse directly above or directly below the origin point. All the points in the spiral will line up along the 4 angles divisible by pi/2, and it will make a square shape.
However, there are many angles and many fractions possible, and I wanted a graph of the interesting areas so I could find different shapes the spiral could make more easily.
What I really wanted as a to graph the complexity of each image, and to see if the nodes where the angles aligned evenly would show up on a larger scale. In hindsight, it might have been much more computationally efficient to work out the formula and just graph that, but there was another technique that I had been curious to try.
Complexity is notoriously difficult to define. It is a slippery thing, and if you define it very carefully and strictly, it becomes almost impossible to measure. Kolmogorov complexity for example, is one such very specific definition, however it is mind bogglingly difficult to measure.
So, I don’t have access to an oracle that will tell me the shortest program that could generate any image, but I do have access to a PNG encoder. A large part of this project was to test out using PNG encoding as an approximation for visual complexity, which could have many applications on further similar projects.
The data was collected by porting the mouse toy to python. Every starting point in a 1080 x 1080 matrix was converted to polar coordinates. Each pair of polar coordinates was then used to draw a spiral, and then the size of the image was measured after PNG compression.
The size of each PNG image was then stored and ultimately become a single pixel value when the 1080x1080 data matrix became a 1080x1080 image. I felt a bit silly later for doing such a large matrix of starting position, because ultimately I needed to scale down the image to fit it on the webpage anyway.
It was a difficult computation. In a single thread, it would have taken something like 20 hours, but this sort of task is “trivially parallelizable”. This means that the different sections of the job don’t need to synch or co-ordinate as they run. Nothing fancy required in this case, parallelizing this kind of computation is almost as easy as setting the original script to run multiple times.
In this particular case, I used a command line argument to tell each script which block to work on, and just set as many to run side by side as my processor could handle.
After they were all done running, after one quick script to piece the data together and 16+ hours of computation time had been saved. The code for generating and compiling the data will be included in the repository. This image was the result.

As I have written this article, it occured to me that I could have saved even more time if I had just figured out the formula that would describe when the angle would form a node. Graphing that as an image would have taken seconds for the computer instead of hours. However, it’s not completely obvious to me at this moment what that formula is. Something related to the remainder of pi divided by the angle surely, but this is complicated slightly by positive and negative pi coming back from the atan2 function.
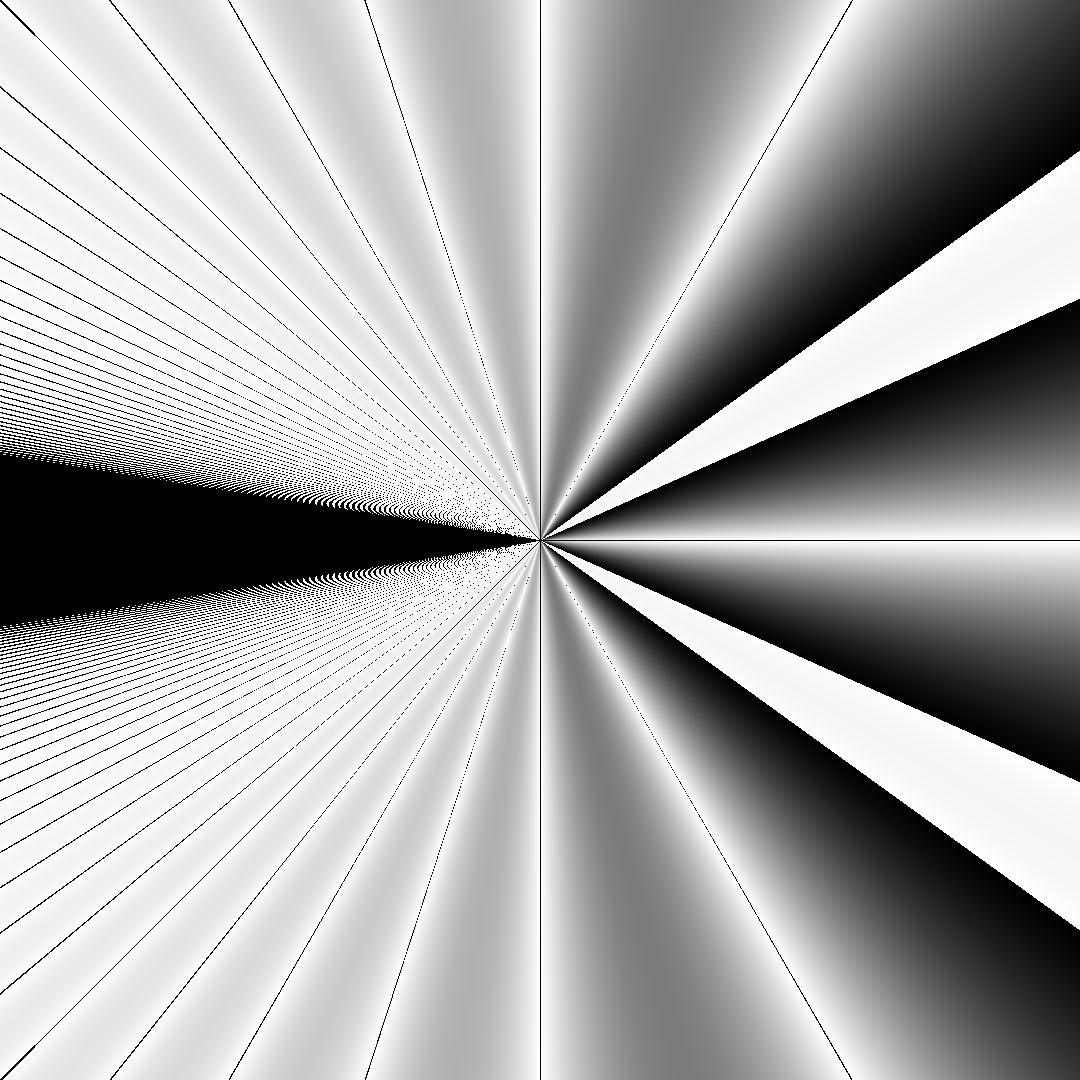
I have taken a bit of time to try to work something out, and I produced this image. It’s something similar to what has been graphed already, but still quite different. Critically, it misses most of the detail related to the nodes in upper and lower right quadrants. I would be curious to learn what formula would faithfully reproduce those features of the data in the future, but it I don’t consider finding this formula critical to completing this project
I like the idea of working with the PNG compression instead. I like the large and expensive computation that it required, along with the distortion that it added. The idea that there can be some precipitous stack of technology piled on top of some basic mathematical truth, but the truth shines through. Perhaps rough around the edges, but clear enough to survive the computational attack.